

May 11, 2021 ( last updated : June 29, 2021 )
tasmota
smarthome
Controlling temperature is a common requirement for many projects. I’ve been using the ITC308 Wifi controllers for years now due to their low price and have been hopeful for a long while that it would be possible to ditch that …challenging… Inkbird App. The main requirement I had was to be able to programmatically specify the set point (SP) as well as record the current process value (PV), ideally in my existing InfluxDB database. This is that journey…
I had spent a bit of time in 2020 looking for attempts to reverse engineer the protocol these devices use with the hope of being able to inject myself in the middle of it. I’d gotten as far as buying a 2nd device to dump the firmware of to assist in this process, but just like all great projects in “the pile” it hadn’t seen the light of day yet. This changed when in early 2021 someone posted on Reddit their steps to get this device working with Tasmota. This led to one obvious outcome.

I discovered on following the comments in that post (and still being new to Tasmota) that there were definitely a few nuances on getting this device working and wanted to share the procedure and configuration that works for me.
For what it’s worth, I now have 3 of these devices running continuously on my network and they have been rock solid reliable over the ~3 months I have had them running.
Before progressing further, it is important to call out that at present all control is through the Command Line interface of the web interface. Further to this, most of the units on the web interface are out by a factor of 100. This isn’t an issue for my usage, but it is definitely not point-and-click.
WARNING: These devices have to be opened and soldered to flash the firmware. They are mains powered. This can be dangerous and should only be done by competent persons. If that is not you, don’t do it yourself.
At heart, these devices use a TYWE3S module, as is documented here: https://tasmota.github.io/docs/devices/TYWE3S/.
As is mentioned on the Reddit post, these particular modules require both the RST and EN pins to be held at 3.3V in order to programmable. Further to this, they require removal from the main controller circuit board to enable driving the appropriate pins. The usual requirements of patience, flux and desoldering wick are required for this, but it is not difficult.
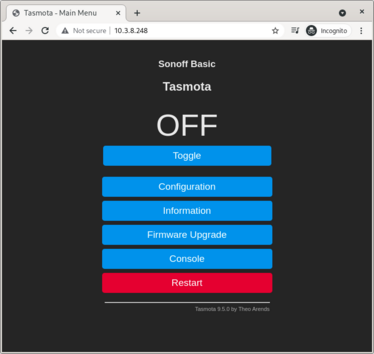
Once removed I soldered wires directly to the module pins and connected this to a 3.3V USB Serial cable with 3.3V VCC to provide power. Plugging this into a laptop and firing up Tasmotizer makes the flashing process a dream. Once flashed, I remove the device from the USB port, de-solder the GPIO0 grounding pin to disable programming mode and use the device configurator in Tasmotizer to set both the wireless network details as well as the credentials for the MQTT server I run. This can all be done later, but this simplifies getting the initial connection. Once the device has restarted, confirm network connectivity both in Tasmota with the “Get Device IP” button, and then confirm access to the device webpage at this IP address.
This is the point that I then power off the device again and desolder all the programming wires, ensuring that the solder between the module and carrier board passes a visual inspection. Again, the use of flux can help tidy joints here. Finally, solder the carrier board back onto the main control board and reassemble the unit, ideally cleaning any and all excess flux with an appropriate board cleaner. With minimal effort the reassembled device should look better than when it arrived from the factory!
Now, power on the device.
These settings are again mostly based on information from the aforementioned Reddit post. When I was undertaking this there was a number of things I didn’t understand about how Tasmota behaved, so spend a long while staring in frustration at things that just didn’t make sense. Hopefully this saves you the trouble:
TuyaMCU (54), Click Apply. Wait for Reboot.
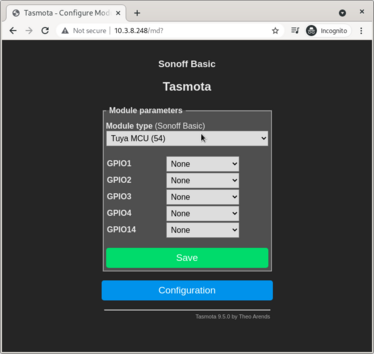
TuyaMCU 71,104 and press enter.TuyaMCU 72,106 in the console and press enter.TuyaMcu 99,1 in the console and press enter.These commands are further documented in the Tasmota TuyaMCU Documentation. I have included a copy of the dpId table below just incase links break in the future.
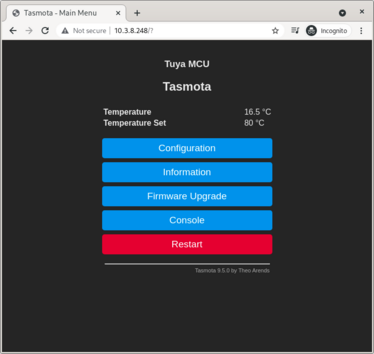
At this point you should be able to see the current temperature and set point in the UI. The set point will be a factor of 100 high due to scaling, this is discussed further in a GitHub issue on the subject.
Usage of the TuyaSend family of commands is relatively straightforward, provided the correct command is used to set the correct value. I have noticed some strange behaviour if you use a send command with a 4 byte float to write to a single byte location. I suspect it is directly writing to memory and overwriting adjacent memory.
All of this configuration is done on the Console.
dpId MapThis Table is from the Tasmota documentation, included below for reference.
dpId |
Function points | Identifier | Data type | Function type | Properties |
|---|---|---|---|---|---|
| 101 | Temperature unit | Cf | Issue and report | Integer | 0=C, 1=F |
| 102 | Calibration | Ca | Issue and report | Integer | Unit is 0.1C |
| 104 | Temperature sensor | Issue and report | Integer | Unit is 0.1C | |
| 106 | Temperature set point | Ts | Issue and report | Integer | Unit is 0.1C |
| 108 | Compressor delay time | Pt | Issue and report | Integer | Unit is minutes |
| 109 | Alarm high temperature | Ah | Issue and report | Integer | Unit is 0.1C |
| 110 | Alarm low temperature | Al | Issue and report | Integer | Unit is 0.1C, For negative values use -(0xFFFFFFFF - value) |
| 115 | Relay status | Only report | Integer | 01=cool, 02=off, 03=heating | |
| 116 | Temperature sensor | Issue and report | Integer | Unit is 0.1F | |
| 117 | Heating differential value | Hd | Issue and report | Integer | Unit is 0.1C |
| 118 | Cooling differential value | Cd | Issue and report | Integer | Unit is 0.1C |
Living in Australia I am lucky enough to use the Celsius scale for temperature. This can be configured on the device with:
TuyaSend1 101,0This particular controller is going on a fridge, so I want to set it to 4°C. Because of the internal scaling by a factor of 10, this results in:
TuyaSend2 106,40
Note that this command is using TuyaSend2 as per the previous command with TuyaSend1. This is a subtle but important detail related to the data type being sent.Cooling Because of the internal scaling by a factor of 10, this results in:
TuyaSend2 118,20Heating Because of the internal scaling by a factor of 10, this results in:
TuyaSend2 117,20If you have been following the configuration up until now, you should have a functioning temperature controller that you can configure and view via Tasmota. Ideally, I would like to bring this data into InfluxDB so that it can be easily viewed in Grafana and alerts can be triggered should an issue arise. Tasmota can not natively communicate with InfluxDB, so I am using MQTT as an intermediary.
The configuration of the temperature controller is such that it will only send the current values of the configuration parameters when a change is made, and the current temperature will be sent at a predetermined frequency of around a couple of minutes. In order to track the configuration of the device, I would like both the current temperature sensor value and the configuration parameters to be sent periodically, so configuration can be verified in the future should an issue arise. Furthermore, the dpId related to the current relay state is only sent on transition, it can not be queried.
One way of forwarding all of this information to MQTT is through the use of Tasmota Rules. These can be triggered when a particular dpId is received, and are capable of sending an MQTT message. Further information is available in the Tasmota documentation, but the following rules have been very useful to improve the status monitoring of the device.
Rules are entered directly into the Command module in the web interface, and can be directly copied from the below multiline snippets.
This rule sets up the publication of parameters over MQTT whenever they are received from TuyaMCU. I have prefixed the values with 308 to remind me that they are raw 308 values, and most of them need to be scaled by a factor of 10.
Rule1
ON TuyaReceived#DpType2Id104 DO Publish stat/%topic%/308_sensor %value% ENDON
ON TuyaReceived#DpType4Id115 DO Publish stat/%topic%/308_status %value% ENDON
ON TuyaReceived#DpType2Id106 DO Publish stat/%topic%/308_set_point %value% ENDON
ON TuyaReceived#DpType2Id117 DO Publish stat/%topic%/308_differential_heating %value% ENDON
ON TuyaReceived#DpType2Id118 DO Publish stat/%topic%/308_differential_cooling %value% ENDON
ON TuyaReceived#DpType2Id101 DO Publish stat/%topic%/308_unit %value% ENDON
ON TuyaReceived#DpType2Id102 DO Publish stat/%topic%/308_calibration %value% ENDON
ON TuyaReceived#DpType2Id108 DO Publish stat/%topic%/308_delay_time %value% ENDON
ON TuyaReceived#DpType2Id109 DO Publish stat/%topic%/308_alarm_high %value% ENDON
ON TuyaReceived#DpType2Id110 DO Publish stat/%topic%/308_alarm_low %value% ENDON
Sets the MCU to Celsius mode on bootup and sends a dummy command to the MCU every minute to convince it dump the current state of the unit. This effectively becomes the reporting period of parameters.
Rule2
ON System#Init DO TuyaSend1 101,0 ENDON
ON Time#Minute DO TuyaSend2 2,1 ENDON
By default the above rules are disabled. They can be enabled with:
Rule1 1
Rule2 1
The reverse can be used to disable the rules:
Rule1 0
Rule2 0
Or it is also possible to just disable the timer (Rule2 0), this still sends the data over MQTT it just doesn’t prompt the unit to send stats periodically.
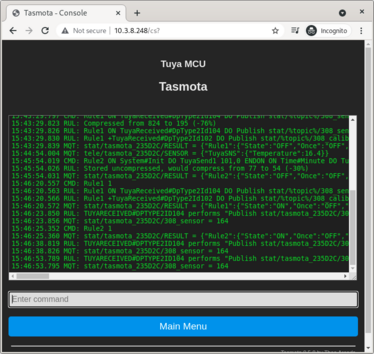
If all has gone well, you should see rules being triggered in your console after no more than a minute. If you have already configured MQTT on this device you should also see the data on the MQTT feed:
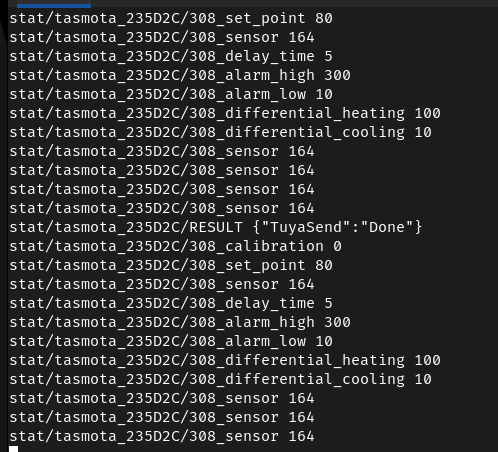
Whilst I would generally use a Python script for this I have been trying to migrate workloads like this to Node-RED for ease of maintenance. To that end, I have a flow running that listens on the relevant MQTT topics, formats the relevant values and forwards this to a local Influx database.

By listening directly on the 308_sensor topic, the current temperature can be read, and parsing this into a function node enables formatting for the influxdb module:
msg.payload = [{"temperature": msg.payload / 10},{"region":"FortKnox","location":"warmer"}]
return msg;
This functionality should be relatively simple to extend to the other parameters reported by the device over MQTT.
Once within InfluxDB it is trivial to display on Grafana, there are many tutorials on this online, so I won’t replicate the details here. There seems to be an internal reporting hysteris, and the resolution isn’t amazing - but it works and is perfectly functional for my usage.

Originally published May 11, 2021 (Updated June 29, 2021)
Related posts :